
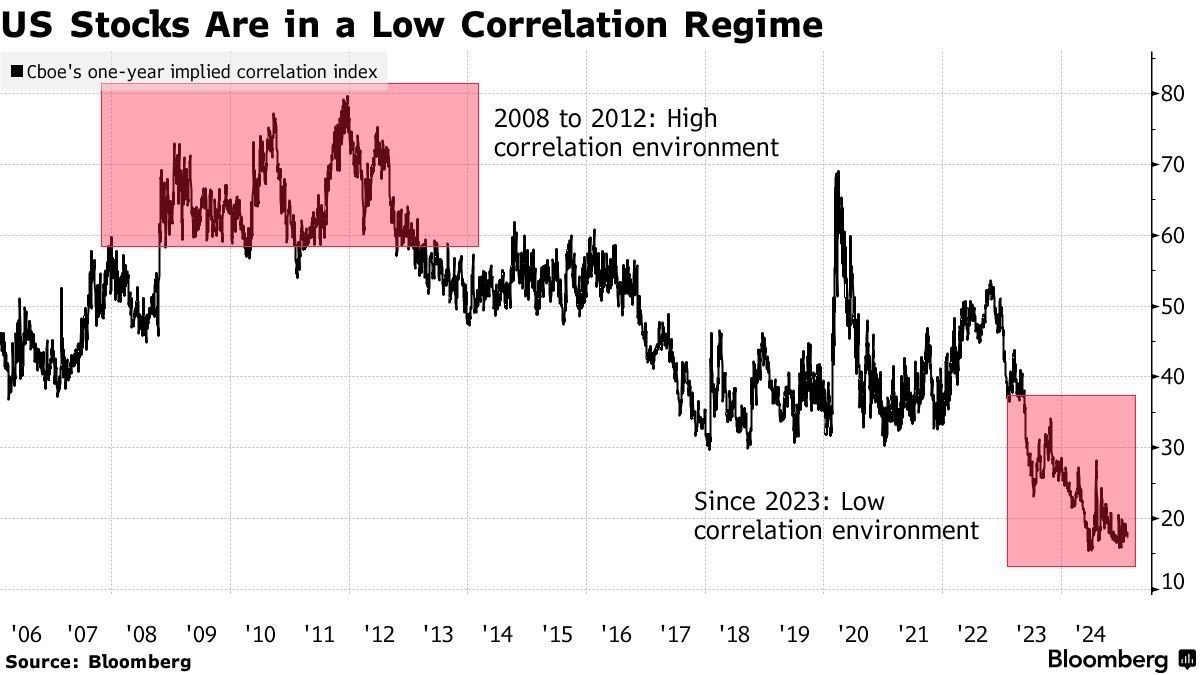
📉 US Stocks in a Low Correlation Regime: What It Means for Investors 📉
The correlation between US stocks has dropped significantly, as illustrated by the Cboe One-Year Implied Correlation Index, which is now at its lowest levels since before the 2008 financial crisis.
🔹 Key Observations from the Chart:
• 2008-2012: A high-correlation regime (>50), driven by the Global Financial Crisis and its aftermath, meant stocks moved in tandem, limiting diversification benefits
• 2013-2022: A gradual decline in correlation, with occasional spikes during market shocks (e.g., COVID-19 in 2020)
• Since 2023: The index has fallen below 20, signaling one of the lowest correlation environments in decades.
🔹 Why Does This Matter?
• Lower correlation enhances the benefits of diversification—stock pickers and active managers may find more opportunities to generate alpha
• During crises, correlations tend to rise, as seen in 2008-2012 and 2020, reducing the effectiveness of diversification
• In today’s regime, investors need a sector-specific and bottom-up approach rather than relying on broad-market exposure
🔹 What’s Driving This Shift?
1️⃣ Mega-cap tech dominance – While the “Magnificent Seven” stocks have led market gains, sector-specific performance varies widely
2️⃣ Higher interest rates & Fed policy shifts – Different sectors react differently to monetary policy, increasing dispersion
3️⃣ AI, reshoring, and sectoral divergence – Structural changes create winners and losers, reducing overall correlation
💡 Investment Takeaway: In a low-correlation environment, a passive index strategy may not be as effective. Active management, factor investing, and sector rotation could be key to outperformance.